

Welcome to the first edition of Web Analytics Monday, #WAM! Each week we will be exploring a new facet of Google Analytics and breaking it down to its simplest and most actionable form so that you have an understanding of how to pull the report, and what to do with it.
Feel free to share any comments or questions at the end of each post. Enjoy!

Conversion Timing
Your site exists for one reason: generating commercial value.
We’re going to disregard the menagerie of available web analytics data and hone in on what really matters: macro conversions, and when they are happening.
Let’s look at two important metrics:
- Time Lag: The amount of time it takes visitors to convert.
- Path Length: How many interactions occur before a visitor converts.
Time Lag
We want to understand how many days it takes the majority of our visitors to convert on site. For instance, do visitors convert on the first day they arrive on the site, or the 30th? This will give us insight into how long their decision-making process is when deciding to engage with a vendor. It also shows us the importance of a visitor’s first impression with our site.
To find the Time Lag report, navigate to Conversions → Multi-Channel Funnels → Time Lag.
You will then want to choose your macro conversions in the selector. For Brafton, our macro conversions happen when someone requests a demo or sends a contact request via our conversion landing page or javascript form fill.
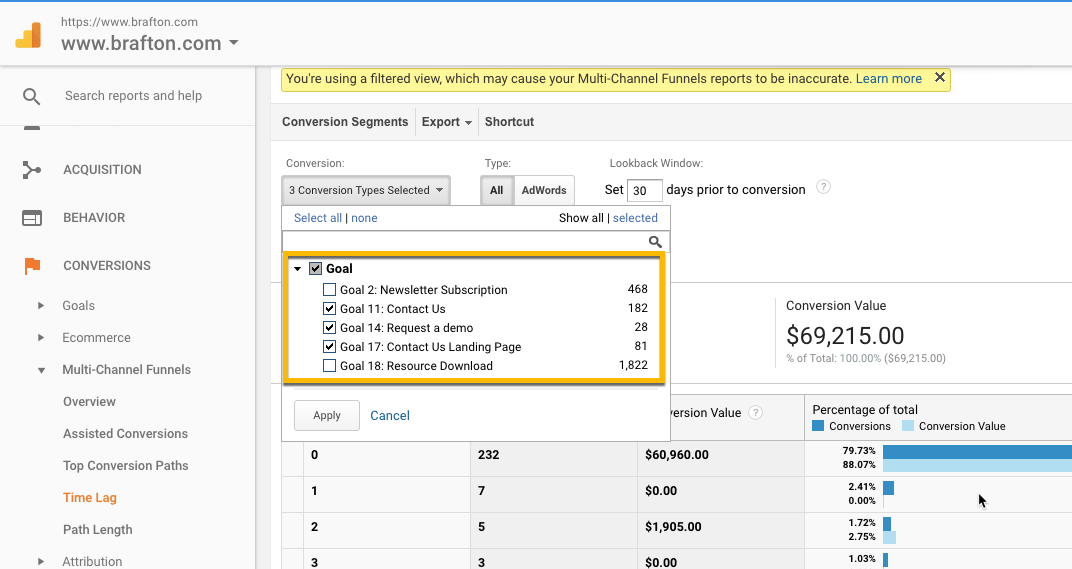
Click apply, and you should see a chart that looks similar to:
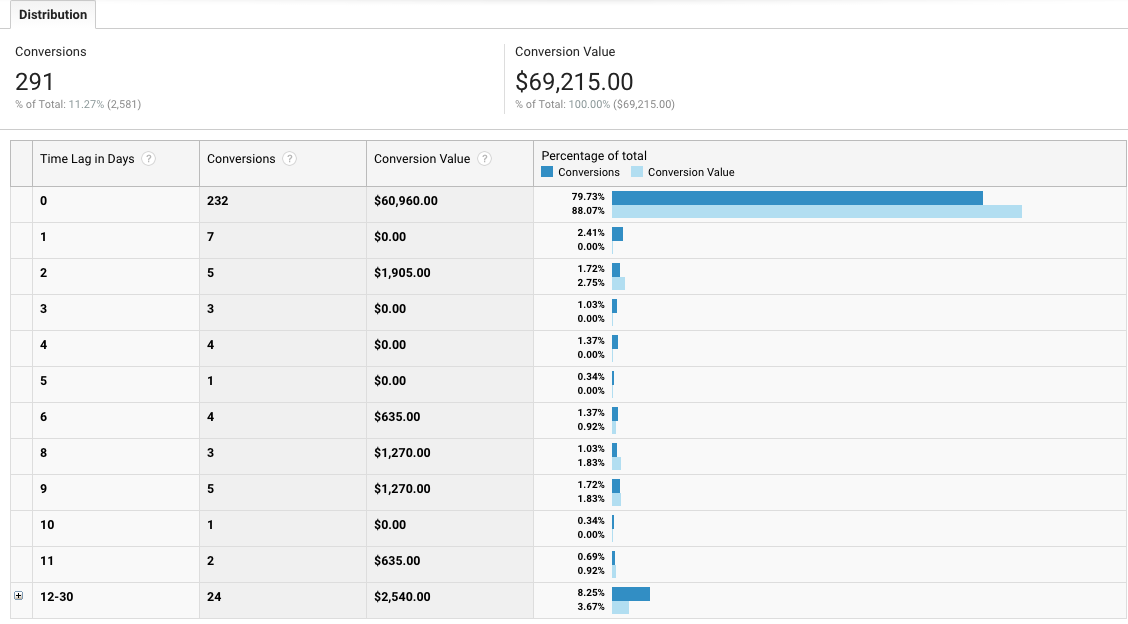
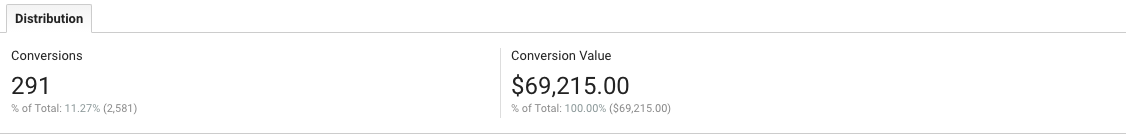
Let’s dig into the different areas of this report. Starting with the top, GA is reporting on 291 macro conversions over the time span, resulting in a goal value of $69,215. We have implemented this goal value based on our web referral close rate and average deal size.
Below is a chart that evaluates conversions over a period of time, and the associated conversion value for each.
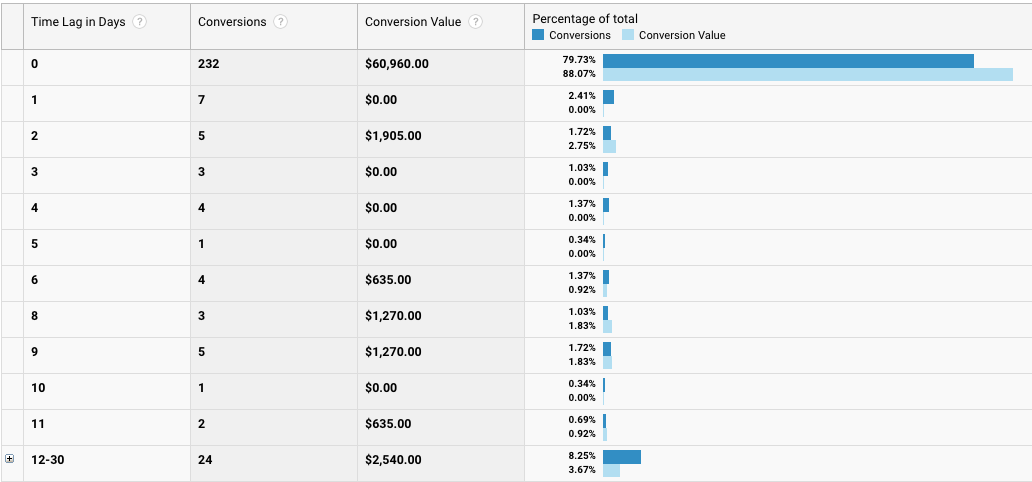
The left hand column tells us the number of days between a visitor’s first experience with our site and when they completed a macro conversion. A time lag of “0” days refers to visitors who convert on the first day they land on a site. Our report indicates that 79.7% of all conversions happen on the first day a visitor lands on our site.

This means that four out of five visitors who submit contact information or requests for a demo do so on their first visit to the site. This is a fairly short cycle – we can make the assumption that these people don’t spend a lot of time deliberating over vendors before requesting more information.
To encourage a conversion, our visitors’ first impression of the site needs to be dead on. Additionally, our user experience needs to be tight, with strong calls to action and easy navigation. That way, visitors find exactly what they are looking for on the first go-round.
The next major group of converters (8% of all) do the opposite of our core audience, deliberating for 12-30 days before deciding to request more information.
These folks are more patient and calculated than our core audience, who like to operate quickly.
Time Lag Summary
We learned that the bulk of our audience is most likely to request contact information on the first day that they interact with our site: They’re either in or out, and they don’t fuss about making a quick decision.
The takeaway here is that we need to user-test our site to ensure it is streamlined with easy navigation and clear calls to action. This audience does not have time for anything less.
Path Length
A “Path” in Google Analytics correlates to a visitor’s course of action before converting. An example path could be:
- Visitor A found Brafton in a Google search and visited the site. Later that day, the visitor went directly to the site and submitted contact information. This visitor’s path would be: Organic Search → Direct
Similar to Time Lag, Path Length gives us an idea of how visitors interact with the site before deciding to convert. It gives us insight into how many touchpoints (via different mediums) a visitor requires before engaging with us further.
To find the Path Length report, navigate to Conversions → Multi-Channel Funnels → Path Length. Again, you will want to select your macro conversions.
You’ll see a report that looks like:
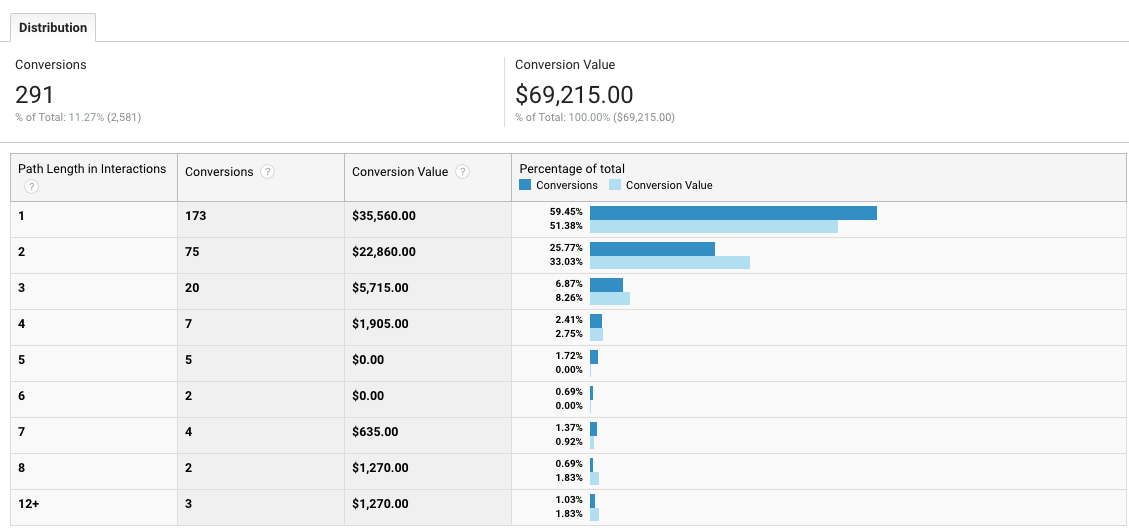
In this report we see a major group emerge: 85% of visitors who submit contact information on the site do so after only one or two interactions.
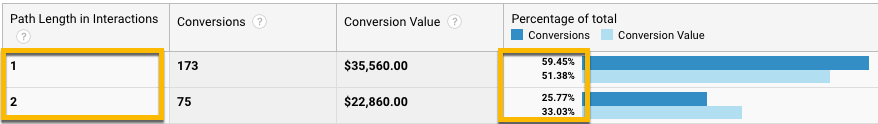
This holds true to our assertion of visitors’ short conversion cycles. Again, we are seeing extremely short attention span behavior that reflects a demand for an incredible user experience on a visitor’s first interaction with our site.
Chasing the shiny red ball
With Time Lag and Path Length reporting we learned that our audience has an extremely short conversion cycle. We can reason that visitors assume very little risk when submitting contact information, and likely our competitors. When we refer to “risk”, we are referring to time and monetary commitment. In our case, visitors are risking a maximum of a thirty minute phone call with a representative, and zero monetary commitment. Submitting contact information to our site comes with very little risk.
Given this shortened conversion cycle, we have to believe that our site converters are exhibiting classic shopping behavior: quickly gathering information from vendors, filtering out poor options and requesting more information from potential matches.
Shopping behavior portends a focused visitor agenda and a low tolerance for poor user experience. Our next steps are to engage in user testing to ensure our navigation and calls to action are as efficient as possible.
Join us next week for another version of Web Analytics Monday.